
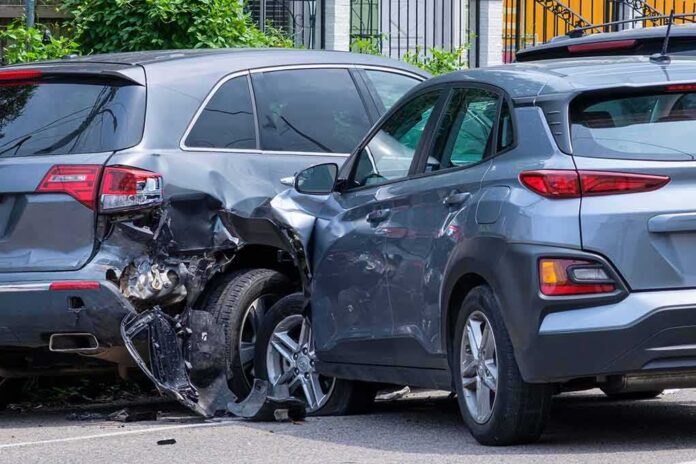
When a heavy SUV penetrates the side of a city bus at an urban intersection, the violence of the physics exposes a hard truth about transit safety: bus crashes are infrequent relative to the miles traveled, yet when they do occur, the people outside the bus—drivers and passengers in smaller vehicles, or pedestrians—bear the worst of the harm.
The Short Version
- Los Angeles Fire Department reported a fatal collision between a Metro bus and an SUV in Chatsworth, with two people killed and six others transported to hospitals.
- The crash occurred just after 5 p.m. at Nordhoff Street and De Soto Avenue; multiple patients were trapped and required extrication.
- The mechanism—an SUV striking the side of a fixed-route bus—aligns with well-studied patterns in which non-bus occupants account for most severe outcomes in bus collisions.
- Rising injury and fatality rates in bus-involved crashes since 2020 underscore why intersection design, operator scheduling, vehicle compatibility, and enforcement matter.
What Happened in Chatsworth
Late afternoon at a busy San Fernando Valley crossroads, an SUV collided with a Metro fixed-route bus, driving the vehicle deep into the bus’s side and transforming a routine rush-hour run into a mass-casualty scene. Firefighters arrived to find multiple victims—some trapped—requiring coordinated triage, extrication, and transport. According to the Los Angeles Fire Department’s official incident alert (INC#1299), the crash at 20900 West Nordhoff Street generated eight total patients; six were transported to local hospitals and two were pronounced dead at the scene. The precise sequence that produced this T-bone impact—signal timing, driver error, speed, or a medical event—will be established by the formal collision investigation. For families and first responders, the core fact is immediate and grim: two lives lost, many others injured.
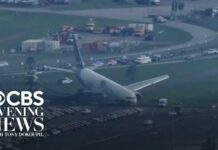
Airborne footage and broadcast coverage captured the aftermath: the bus forced onto the sidewalk, the SUV’s front end destroyed, first responders cutting through metal to reach people. These images are not merely sensational; they illustrate the basic incompatibility problem at the heart of bus-to-passenger-vehicle crashes. A high-riding, stiff, multi-ton bus struck at angle by a tall SUV channels crash energy and intrusion in ways that smaller vehicle occupants and bystanders often cannot survive.
Why Side-Impact Collisions with Buses Are So Punishing
Transit-bus safety research consistently shows that while bus occupants frequently escape with survivable injuries, the deadliest outcomes cluster outside the bus—among pedestrians and those in the other vehicle. Decades of U.S. and European data converge on the same point: collisions account for the vast majority of bus-related fatalities, and in bus-to-passenger-vehicle crashes, people in the smaller vehicle account for nearly all of the deaths. Earlier crashworthiness work found that bus occupant fatalities skew toward frontal impacts, whereas injuries are widely distributed by impact direction; side intrusions, however, are catastrophic for the struck party when the “other vehicle” is a lighter, energy-absorbing shell not designed to withstand a bus’s mass and ride height.
The angle collision seen in Chatsworth—an SUV broadsiding or being broadsided by a fixed-route bus at an intersection—fits those patterns. National Transit Database analyses and follow-on summaries have long highlighted front and angle collisions as producing higher injury and fatality rates and more property damage than low-speed scrapes or rear-end events. For pedestrian-heavy systems, pedestrians often represent the single largest share of fatalities; for bus-to-vehicle crashes, the smaller vehicle’s occupants typically absorb the worst outcomes. This is not a paradox; it’s the geometry and stiffness mismatch doing exactly what physics dictates.
The Broader Trend: Fewer Crashes, But Worse Outcomes Since 2020
In the late 2010s, serious bus-collision fatality counts and rates were relatively stable. That changed with the pandemic-era traffic mix and post-pandemic driving behavior. National summaries indicate fatality rates in bus-involved collisions increased by roughly 50% when comparing 2018–2019 to 2020–2023, while injury rates have ticked up annually since 2021. The drivers are multifactorial: changes in traffic volumes and speeds, degraded driving norms on lightly policed arterials during pandemic-era lows, and lingering shifts in risk tolerance behind the wheel. For transit agencies, this has had a double effect—exposing operators and riders to higher-severity events and increasing third-party harm at intersections where buses mix with hurried, distracted, or impaired drivers.
Scheduling and human factors also matter. Preliminary analyses have flagged elevated collision rates after operators return from multiple days off and during longer shifts—signals that fatigue, circadian rhythms, and route demands can heighten risk windows even in otherwise routine service. None of this assigns fault in a particular case; it defines the field on which every urban bus now competes for safety in traffic that is, on average, less forgiving than a decade ago.
Mechanisms and Countermeasures: Designing for the Crash You Can’t Avoid
In safety engineering, you assume some crashes are inevitable and then design to make them survivable. For buses at intersections, four levers consistently show promise:
• Intersection design and separation: Leading pedestrian intervals, bus-only signal phases, protected turns, and concrete islands that physically separate conflict points reduce angle impacts—the highest-severity geometry—without slowing the entire network to a crawl. Agency guidance has increasingly prioritized these treatments where fixed-route buses run frequent, all-day service through signalized arterials.
• Vehicle compatibility: While buses cannot be “softened” like passenger cars without compromising structure, there is room at the margins—energy-absorbing side-structures near common impact zones, underride mitigation where feasible, and interior features that prevent secondary injuries to standing riders. Historically, improvements have focused on frontal crashworthiness for bus occupants; more recent research pushes toward reducing harm to other road users, who sustain the bulk of fatalities in bus-related crashes.
• Operator workload and scheduling: Data-driven rostering—reducing long, late shifts after multiple days off, calibrating recovery time at route terminals, and fatigue-monitoring—addresses documented risk spikes tied to operator hours and recovery cycles. These interventions are measurable, auditable, and generally cheaper than large capital rebuilds.
• Enforcement and culture on the roadway: The physics that killed in Chatsworth began with a red light, a speed choice, or an attention lapse. Automated enforcement at high-injury intersections, visible traffic-calming cues, and consistent adjudication raise the cost of risky behavior. Cities that have paired transit-priority signals with red-light cameras at the same junctions report better compliance and fewer severe angle crashes; the transit system reaps the safety dividend even when the bus is not at fault.
Reading the Pictures Without Letting Them Mislead
Crashes involving buses are more likely to become headline news than statistical norms would predict—television and online outlets select for scale, visibility, and the presence of a bus itself. That’s understandable; a city bus on the sidewalk is a signal of public risk. But it also creates a cognitive trap: our perception of danger drifts toward the most dramatic imagery rather than the most common harm. Academic reviews of crash reporting repeatedly show how coverage misrepresents risk profiles, over-weighting conspicuous events and underplaying the pedestrian and intersection context in which most fatalities occur. The right conclusion is not to discount the horror of a single event; it is to draw the correct lesson from it.
In Chatsworth, the most useful frame is the one the data already support. Intersections are where fixed-route buses are most exposed to high-energy conflicts. Angle impacts punish occupants of smaller vehicles and the unprotected. And in the last several years, the severity of these events has risen even as agencies professionalize safety programs. The answer is engineering, scheduling, and enforcement discipline applied relentlessly where buses and the public meet: at signals, at curbs, and in the seconds when a stale yellow turns to a decision.
What It Means Going Forward
Two lives in Los Angeles cannot be restored by policy. But their loss can guide risk reduction with a specificity that resists euphemism. For the agency: interrogate operator schedules around high-risk windows, audit intersection controls on frequent routes, and pursue vehicle-side research where it will most reduce third-party harm. For the city: pair transit-priority treatments with automated enforcement at the very intersections that carry frequent bus service through multi-lane arterials. For drivers: recognize that the combination of speed, distraction, and a stale green at a wide Los Angeles junction is not a time-saver—it’s a bet against mass and momentum you won’t win.
Sources:
nypost.com, latimes.com, ktla.com, lafd.org, abc7.com, cbsnews.com, nbclosangeles.com, foxla.com